Horizontal Infographic Four
Need to showcase company growth, project phases, or product evolution in a clean, professional way? Horizontal Infographic Four is built for exactly that — a versatile, production-ready timeline template designed to turn milestones into visual storytelling.
This isn’t just another decorative graphic. It’s a fully editable, vector-based resource crafted for clarity and impact. Whether you're launching a startup, reporting quarterly wins to stakeholders, documenting curriculum development, or illustrating a client’s journey from onboarding to ROI, Horizontal Infographic Four delivers structure without sacrificing style.
What Makes This Template Stand Out
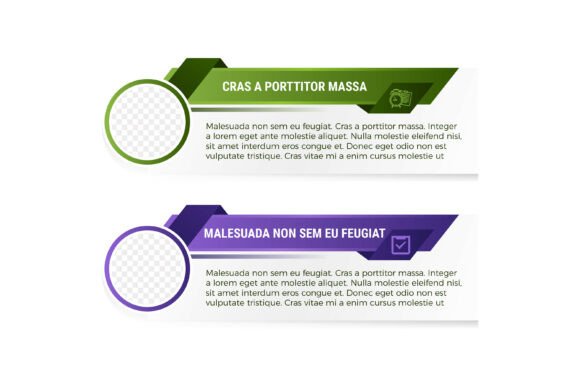
At its core, Horizontal Infographic Four features four distinct milestone points arranged left-to-right along a subtle horizontal axis — ideal for linear progression narratives. Each point centers around a large, high-visibility circle photo placeholder with soft shadow effects, ensuring your visuals command attention while maintaining balance.
The design uses a refined grey gradient background — neutral enough to complement any brand palette, yet rich enough to add depth and sophistication. Four coordinated color variations (think deep navy, warm terracotta, cool teal, and muted sage) let you match tone to audience: corporate reports lean into the navy; education or wellness brands may prefer the sage or terracotta.
Each variation includes custom-designed icons — minimal, modern, and legible at any scale — paired with sample text labels that demonstrate hierarchy and spacing. You’re not stuck with placeholder copy; every word is editable. So is every shape, stroke, and fill. No raster dependencies. No pixelation. Just pure vector flexibility.
Real-World Uses Across Roles
Marketers use Horizontal Infographic Four to visualize campaign timelines — from strategy kickoff to A/B testing results to post-launch analysis. The clean layout makes it easy to embed in pitch decks or share as a LinkedIn carousel slide.
Entrepreneurs and small business owners often repurpose it for “Our Journey” pages on websites or investor one-pagers. Replacing stock photos with authentic team shots inside the circle placeholders builds trust instantly — especially when paired with concise, outcome-focused text like “Launched MVP → 500+ Beta Users → Secured Seed Funding.”
Educators and course creators adapt it for syllabus overviews or learning path maps — e.g., “Foundations → Core Skills → Capstone Project → Certification.” The horizontal flow mirrors how learners progress mentally, making complex sequences feel intuitive.
Freelancers and agencies integrate it into client reports to highlight deliverables across sprints or phases. Because all elements are layered and named logically in the source files (AI and EPS), swapping colors or adjusting spacing takes seconds — not hours.
Even bloggers and content publishers find value here. Turn a “How We Built This Tool” story into a scannable visual summary. Readers absorb timelines faster than paragraphs — especially on mobile — and the shadowed circles create natural focal points amid scrolling content.
Why Vector + High-Resolution Matters
This file ships in AI, EPS, SVG, and JPG — all at 300dpi. That means you can scale the infographic to billboard size without blurring, export crisp PNGs for web use, or drop the SVG directly into a CMS for responsive rendering. No upscaling. No quality loss.
Because everything is 100% vector, resizing doesn’t distort icons or text. Kerning stays tight. Shadows remain smooth. And if your brand updates its color system next quarter? One global swatch change updates all four milestones at once — no manual recoloring required.
Smart Implementation Tips
Start by auditing your message before opening the file. Ask: What’s the *one thing* this viewer should remember? Then align your four milestones to support that idea — not just chronological order. For example, instead of “Q1, Q2, Q3, Q4,” try “Problem Identified → Prototype Tested → User Feedback Integrated → Market Launch.”
Respect visual hierarchy. Use the largest font weight only for milestone titles — keep descriptions brief (12–16 words max). Let the circle photos do emotional heavy lifting; your imagery should reinforce, not compete with, the narrative.
If you’re embedding in presentations, test contrast against your slide background. The grey gradient works well on white or light-grey slides, but may need a subtle overlay or border adjustment on dark themes.
And don’t overlook the SVG version. It’s lightweight, accessible (with proper alt text added), and supports CSS-driven interactivity — like hover effects or animated reveals — if you’re building an interactive webpage or digital report.
Final Thoughts for Practical Buyers
Horizontal Infographic Four isn’t about flashy effects — it’s about reducing friction between idea and execution. You get professional-grade assets without needing advanced design skills. Well-organized layers mean even beginners can isolate and edit text boxes or icons without disrupting alignment. Experienced designers appreciate the intentional spacing, consistent shadow depth, and thoughtful icon-to-text ratios.
It’s also future-proof. Since all graphics are vector and resolution-independent, this template stays relevant whether you’re updating a PDF annual report today or designing a new microsite six months from now.
If you’ve ever spent more time wrestling with alignment guides than refining your message, this is the reset you’ve been looking for. Clean structure. Real flexibility. Zero guesswork.
Download includes AI, EPS, JPG, and SVG — ready when you are.