Scientist Illustration: A Practical Asset for Clear, Consistent Science Communication
Scientist Illustration is not just a set of images—it’s a workflow enabler. Designed for clarity and flexibility, this professional collection supports how people actually work: planning presentations, building educational resources, designing digital interfaces, or developing branded science content. Its value emerges not in isolation, but in how seamlessly it integrates into existing tools, timelines, and team processes.
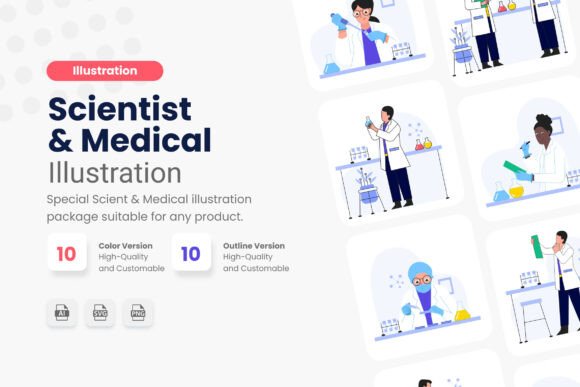
The collection—labeled Scientist Illustration Set—features ten distinct, fully editable vector illustrations. Each shows scientists engaged in authentic lab activities: analyzing data on screens, handling pipettes, reviewing molecular models, collaborating over diagrams, or calibrating equipment. The clean, modern style uses uncluttered shapes, intentional color contrast, and legible proportions—making visuals instantly readable at small sizes or in dense layouts.
Where It Fits in Your Workflow
Scientist Illustration functions across multiple phases—not as a one-time download, but as a reusable component that adapts to shifting needs.
Before a project begins, it helps define scope and tone. When pitching a STEM curriculum update or scoping a health-tech website redesign, dropping an illustration into a mood board or wireframe signals intent faster than paragraphs of description. It aligns stakeholders visually before code is written or copy is drafted.
During execution, it reduces friction. Educators building slide decks insert SVG files directly into PowerPoint or Google Slides; designers import AI or SVG assets into Figma or Adobe XD without raster quality loss; marketers embed PNGs with transparent backgrounds into email templates or landing pages. Because all files are provided in both vector (AI, SVG) and high-res raster (PNG) formats, there’s no need to convert, rescale, or compromise on fidelity—whether the output is a 4K webinar slide or a printed conference handout.
After delivery, it supports iteration. Since every file is fully editable—colors, labels, clothing, even equipment details can be adjusted—the same base illustration can serve multiple versions of a resource. A single “scientist at microscope” asset might become three variants: one showing fluorescence imaging for a biotech client, another with CRISPR notation for a university module, and a third simplified for middle-school materials—all from the same source file.
Integration With Common Tools and Teams
Compatibility isn’t theoretical—it’s tested in daily use. Illustrator users open the AI file and adjust layers or typography in seconds. Web developers pull SVGs into HTML img or inline tags, applying CSS filters or responsive sizing without external dependencies. Content creators drop PNGs into Canva, Notion, or WordPress—no plugin required.
For teams, consistency matters more than variety. Scientist Illustration avoids stylistic outliers: no exaggerated poses, inconsistent lighting, or ambiguous gender or ethnicity cues. Instead, figures follow a unified visual language—balanced proportions, neutral expressions, and inclusive representation—so they cohere across slides, infographics, and UI elements without needing custom art direction each time.
This predictability saves time during reviews. Instructional designers don’t debate whether an illustration “feels scientific enough.” Developers don’t request alternate file types mid-sprint. Writers don’t pause to describe what’s already clear in the image. That shared clarity shortens feedback loops and reduces revision rounds.
Practical Implementation Tips
- Organize by use case, not file type. Create folders like “Lab Process Slides,” “Website Hero Banners,” or “Print Handouts”—then place matching SVG and PNG versions inside. This mirrors how you’ll reach for them, not how they were delivered.
- Test transparency early. Even though all PNGs include transparent backgrounds, preview them over your actual UI or layout colors. Some light-on-dark combinations may need subtle shadow or stroke adjustments—easily done in any vector editor.
- Standardize naming. Rename files upon download: scientist_pipetting_v2.svg, scientist_data_analysis_print.png. Avoid generic names like “illustration_03” that lose meaning after two projects.
- Batch-edit for brand alignment. Use global swatches in Illustrator or Figma to swap accent colors across all ten SVGs in under a minute—ideal when adapting assets for a client’s palette or institutional guidelines.
Quality Control and Long-Term Usability
Each illustration is hand-crafted—not AI-generated—ensuring anatomical plausibility, accurate lab tool depiction (e.g., proper pipette grip, realistic gel electrophoresis setup), and contextual relevance. That attention translates directly into credibility: learners trust visuals that reflect real practice; editors select assets that withstand scrutiny from subject-matter experts; publishers avoid last-minute replacements due to factual inaccuracies.
Long-term, the vector foundation future-proofs usage. As screen resolutions increase or print standards evolve, you won’t need to re-purchase updated versions—you’ll simply scale or refine what you already own. And because the files are exclusively available on Creative Fabrica, you’re assured of licensing clarity: no hidden attribution requirements, no risk of duplicate assets appearing elsewhere.
Real-World Applications Across Roles
Educators embed Scientist Illustration into LMS modules, lab safety guides, or interactive quizzes—using SVGs for crisp rendering on tablets and PNGs for downloadable PDFs. The consistent scientist personas help students recognize recurring roles (e.g., “data analyst” vs. “field researcher”) across units.
Freelance designers keep the set in their starter kit for science clients—cutting proposal turnaround time by 30–50% when mockups require immediate visual context. Clients respond faster to designs that show *how* information will be presented, not just *what* text will appear.
Small business owners in edtech or biotech use the illustrations to humanize technical messaging—replacing stock photos of stiff lab coats with approachable, activity-focused scenes. That authenticity builds trust without requiring custom photo shoots or illustration commissions.
Bloggers and science communicators pair illustrations with explainer posts—e.g., overlaying a “scientist reviewing chromatography results” image next to a step-by-step breakdown. Visual anchors improve retention, especially for complex workflows where readers skim first and dive deeper later.
Making It Sustainable
Like any well-chosen tool, Scientist Illustration gains value with repetition. Track where and how often you use each illustration—note which ones appear most in high-engagement content or client approvals. Over time, that reveals patterns: perhaps “collaborative whiteboard session” works best for innovation-focused messaging, while “scientist documenting field samples” resonates strongest in sustainability reporting. Let usage data guide future purchases or custom adaptations.
Also consider accessibility. While the illustrations themselves are visual, pairing them with concise alt text (“Two scientists comparing DNA sequence data on dual monitors”) ensures screen reader users receive equivalent context. That small habit reinforces inclusion without slowing production.
Ultimately, Scientist Illustration succeeds not because it’s exhaustive, but because it’s precise. It doesn’t try to cover every possible science scenario—instead, it delivers ten strong, adaptable, technically sound representations of research work. That focus makes integration frictionless, editing efficient, and outcomes reliable—whether you’re launching a course, shipping a product, or clarifying a concept for the first time.